Motivation
Degraded quality of GNSS data observation represents an incorrigible error which should be identified as soon as possible. The Quality Control (QC) of the GNSS data is crucial for monitoring the performance of sensors, site environment and their changes in time. The knowledge of data quality and quantity is also useful prior data preservation, dissemination and utilization. The QC is eventually important for providing a feedback on data relevancy to the provider, and for providing a priori information for users interested in data analysis.
Principles
GNSS data quality control consists of
- Metadata verification (format and header validation)
- Quantitative control (algorithm-independent analysis)
- Qualitative control (algorithm-dependent analysis)
- Complex control (positioning solution)
Global navigation data is a mandatory input for both qualitative and complex control when using observation and navigation data along with various processing algorithms and approximations.
Meta data control
The format and meta data verification provides feedback on icorrect file generation by returning a simple QC status code, or more detailed notification on user request. The G-Nut/Anubis supports the RINEX header input data verification with respect to meta data provided by user, e.g. in Anubis XML settings, in SINEX file, or GeodesyML file (in near future).
Quantitive control
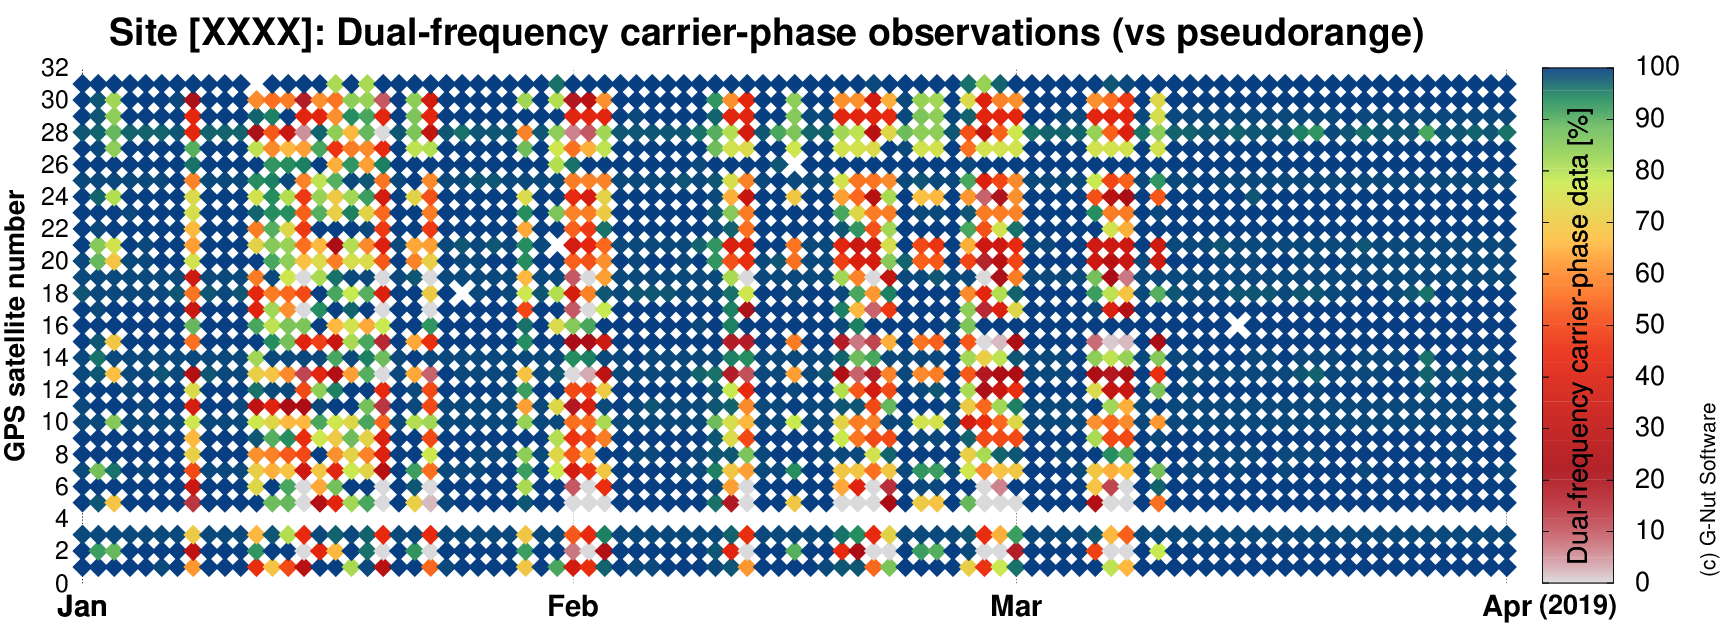
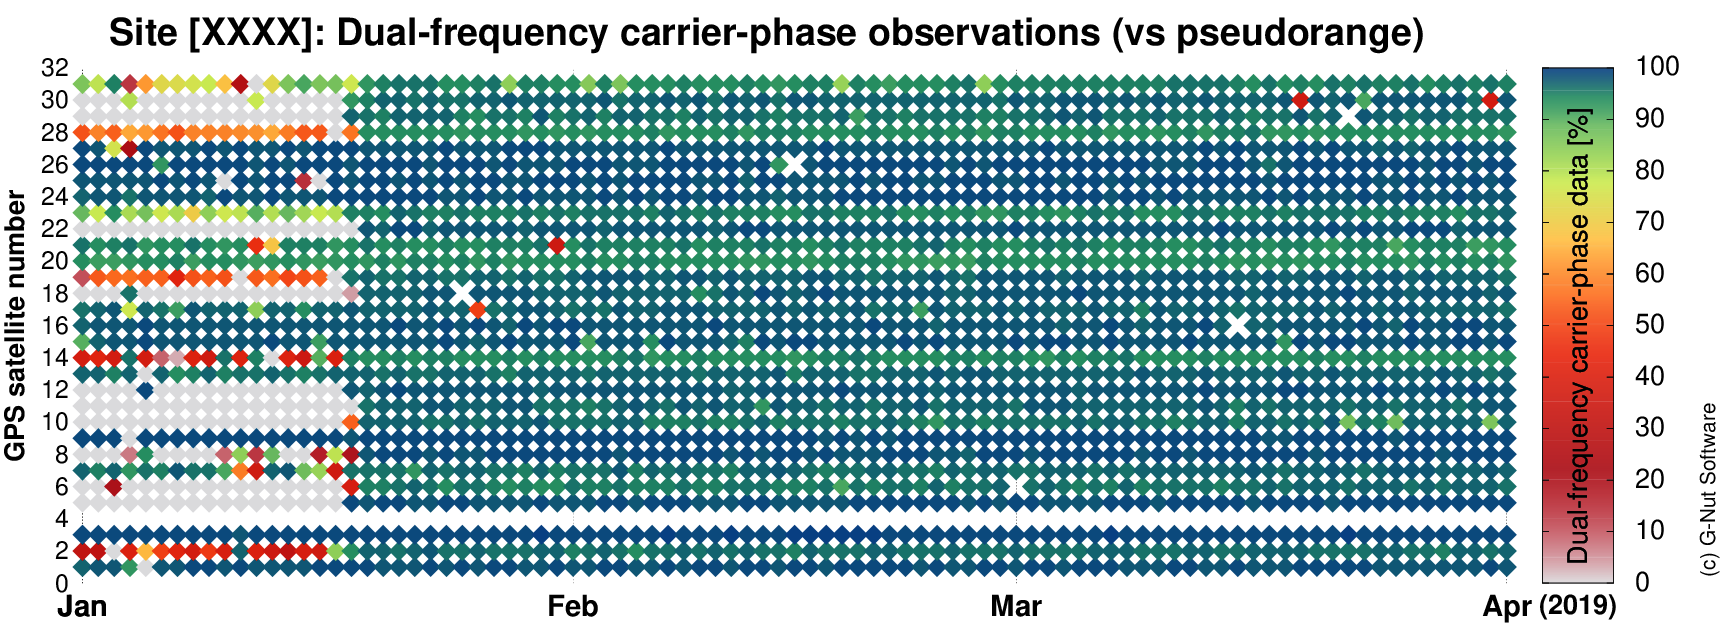
The quantitative data control relies on summarizing mechanically countable information, e.g. observed GNSS constellations, satellites, bands/frequencies, observation types/signals which all are most important to characterize the data content and its completeness (presence of data gaps, single-frequency observations etc). This can be estimated without use of algorithms and navigation data, and the QC result characterizes actual content of the file. Figure shows two examples of losses of dual-frequency carrier-phase observations for individual satellites during a three-month period.
Qualitative control
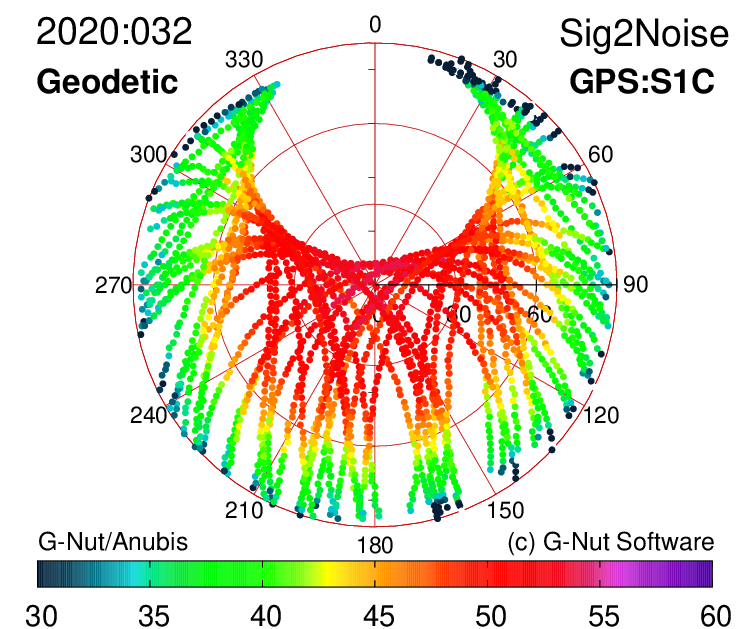
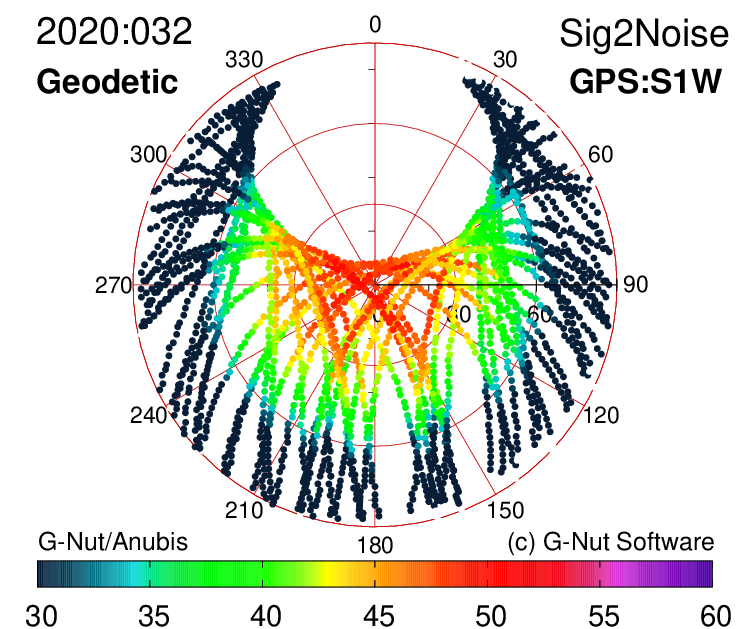
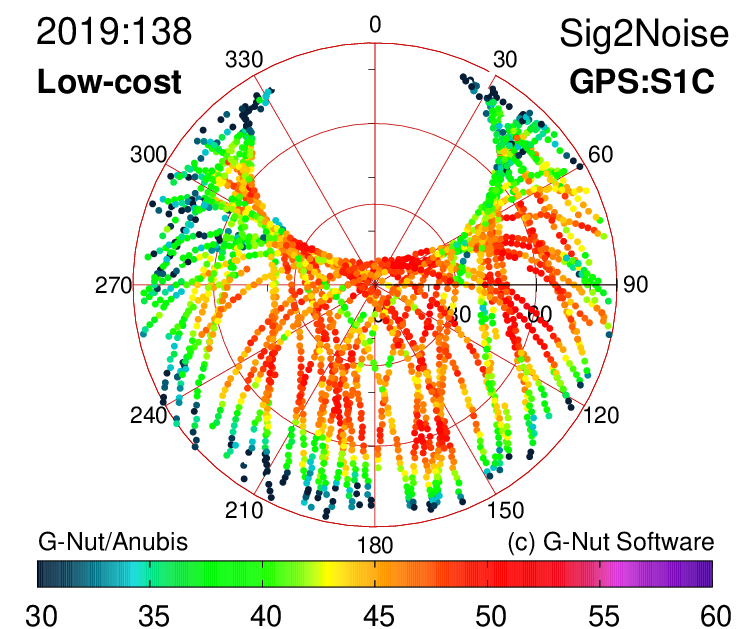
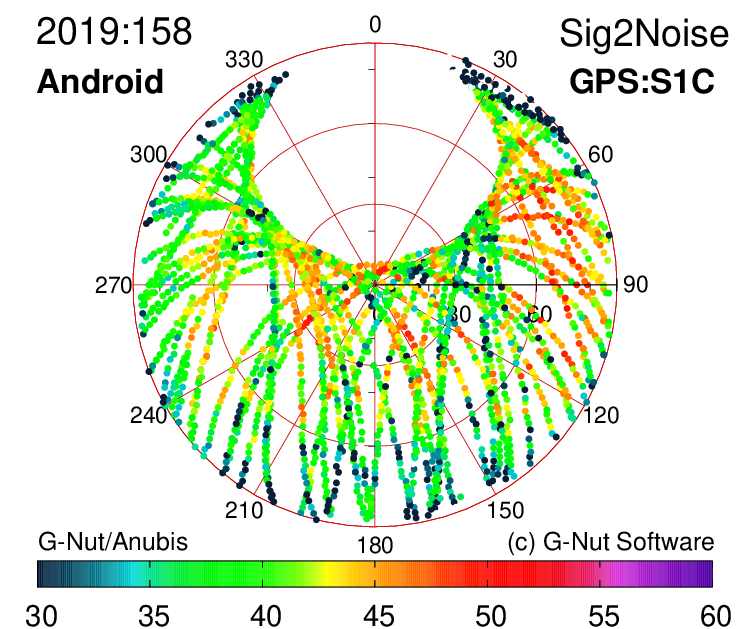
The qualitative data control relies on specific algorithms and requires information about satellite positions. This control characterizes an actual quality of GNSS data, however, the QC result depends on applied algorithms and approximations. Qualitative aspects include environmental effects (code multipath, obstructions), quality of receiver tracking (cycle slips, clock jumps) but also counts of theoretically expected observations and elevation histograms. Most of the procedures require satellite positions and observation azimuth and elevation angles. Figures show skyplots of example signal-to-noise ratio characteristics of different receivers/antennas, signals or site environments.
Complex control
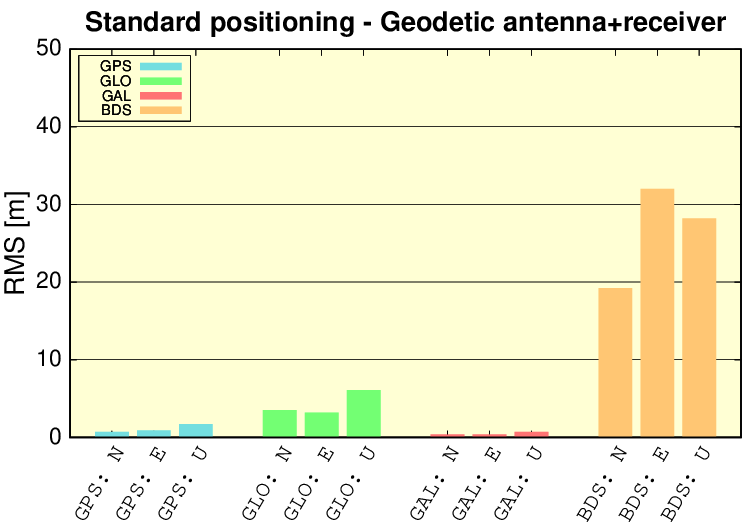
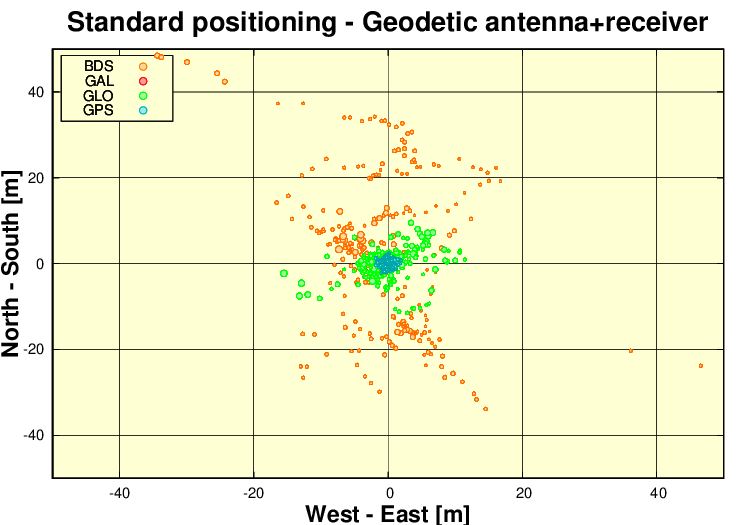
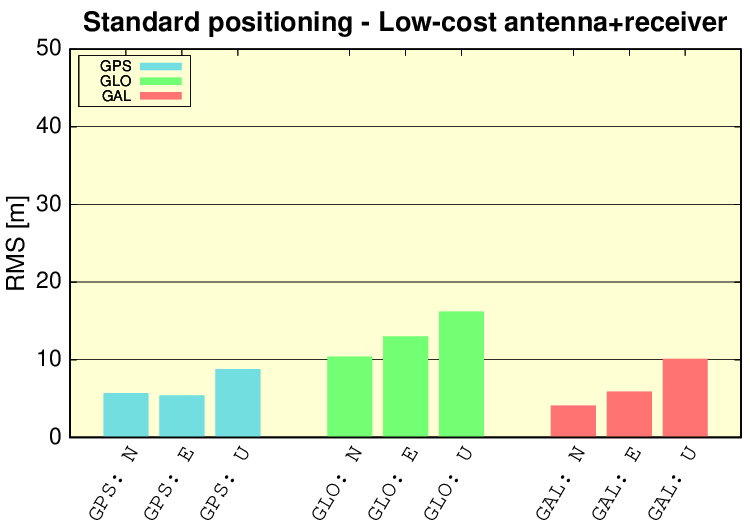
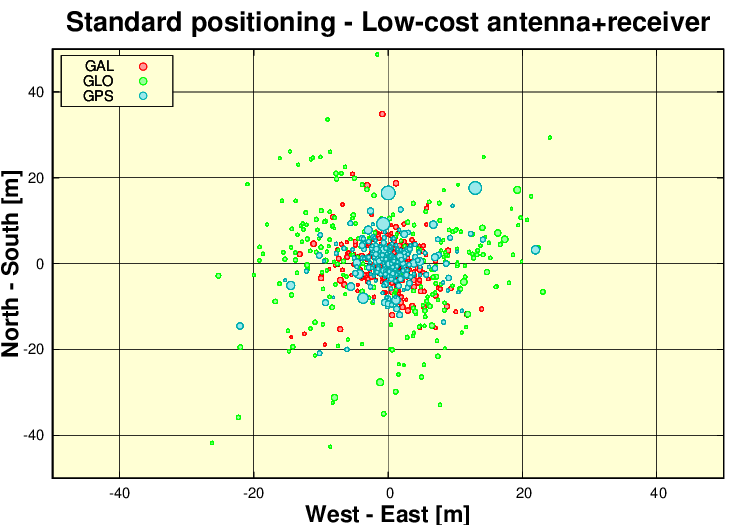
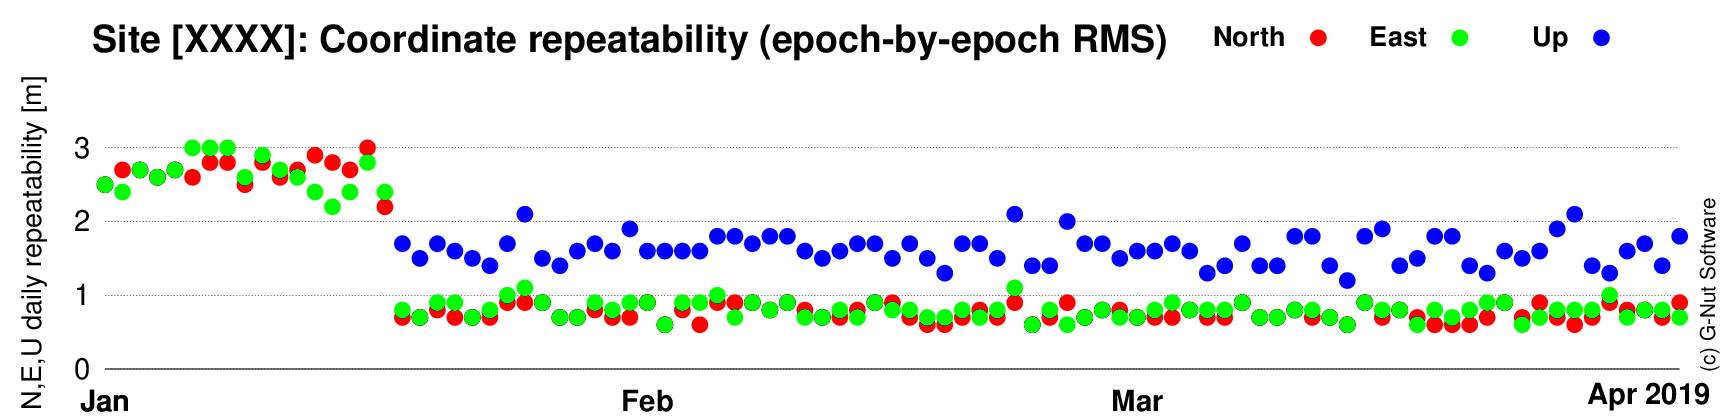
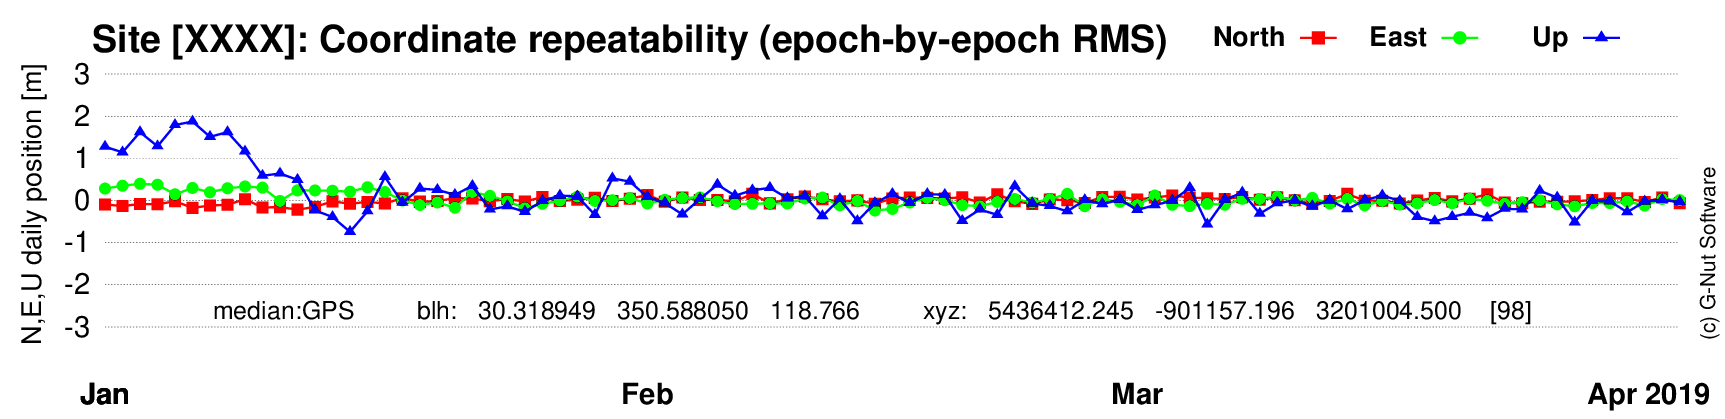
The complex control provides a complete view on data performance through the standard point positioning. The method includes the calculation of corrections for receiver clocks which might be important for specific stations monitoring too. The complex QC requires external information about satellite positions and clocks and a robust processing algorithm. Dual-frequency observations and channel numbers for GLONASS satellites are required too. The complex QC provides receiver clock corrections, dilutions of precision (DOPs), system-specific position estimates (a meter-level accuracy) and coordinate repeatability estimated from epoch-by-epoch positioning if the receiver persists in a static mode. Figures show examples of North, East and Up coordinate residuals and repeatability from a single day and from a 3-month monitoring period.
Data editing
The editing and translating provides an additional functionality to modify metadata, the file format or its data content including a filtering of epochs, systems, satellites, signals, frequencies or tracking modes.
Operation modes and inputs
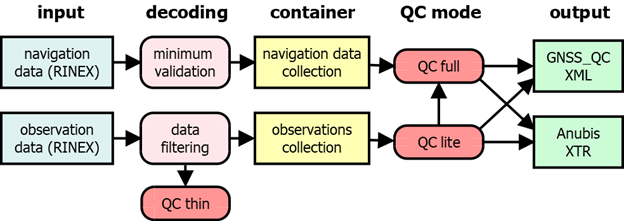
The G-Nut/Anubis tool has been designed to support several operational modes with various QC outputs:
- QC thin mode for the format checking only,
- QC lite mode for the quantitative check,
- QC full mode for qualitative and complex checks,
- edit mode for file content editing or translating.
The quantitative control can be performed in a lite QC mode using observation data only. The qualitative and complex control requires a full QC mode, thus using observation and navigation data in addition including processing algorithms and some approximations. The figure depicts relations of different modes to relevant inputs and outputs.
Visualization
Various plots from such GNSS QC analysis can be generated when considering different goals, e.g. detail site environment monitoring, checking data file completeness and quality, assessing long-term site performance, degradation and changes, and others. Three generic view levels can be recommended for a station/network operator:
- plots with full details based on a single data file,
- plots with time-series of various QC parameters for individual station,
- plots with long-term comparison of selected QC key parameters over group of stations.
Single station (detail) plots
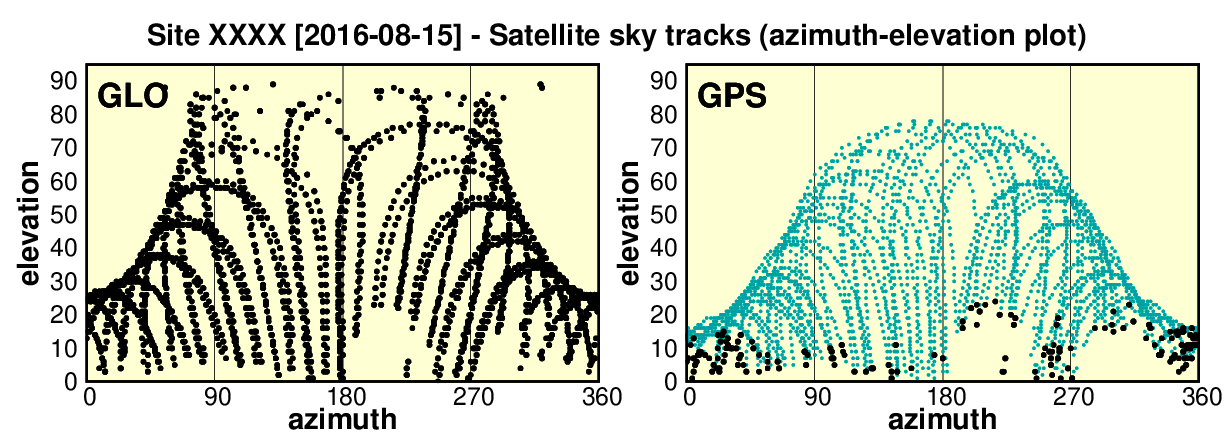
A single station QC analysis provides all details of the site performance, including its instrumentation and environment. Detailed QC plots can be created with a dedicated visualization tool (e.g. plot_Anubis.pl) if a comprehensive output is available from the QC full-mode analysis. A 24-hour data analysis provides sufficient information about site environment, signal obstructions, receiver tracking performance and its configuration, and others. Apparently, the most interesting outputs are skyplots with multipath and signal-to-noise ratio information, graphs of satellite visibility and site obstructions, observation availability and quality including tracking performance (single-/dual-/multi-frequency, signal interruptions, presence of data gaps or carrier-phase cycle slips etc). The figure shows an example of available dual-frequency (blue) and single-frequency (black) observations for GLONASS and GPS systems and two obstructions close to the horizon.
The detail QC analysis and visualization is recommended for any permanent reference station to be performed:
- prior/at the first installation (and optimally prior its installation),
- once per month at least, i.e. regularly (to avoid any slow degradation),
- if planned or unplanned change occurs (instrumentation updates or environment changes, malfunctioning or tracking degradation).
Long-term performance monitoring
A long-term performance monitoring is useful for identifying events such as a long-term receiver degradation, changes in the site environment, changes in instrumentation and configuration. It requires a proper selection of pre-selected QC parameters as no detail graphs can be supported. Additionally, the system should be optimally driven by a database engine, and enables interactive visualization of results in both network and station views. The former aims at providing an overview of selected QC parameters for all stations in the network, thus giving a chance of their relative comparison. Critical is defining a limited set of key QC parameters helpful for easy detection of any kind of events. The station view then should complete more QC parameters for the affected station. An example of the long-term monitoring system is given at G-Nut's QC-charts. Key QC parameters can be generally groupped into different categories in both views:
- system-independent parameters (or summary over all systems),
- system-specific parameters,
- signal-specific parameters.
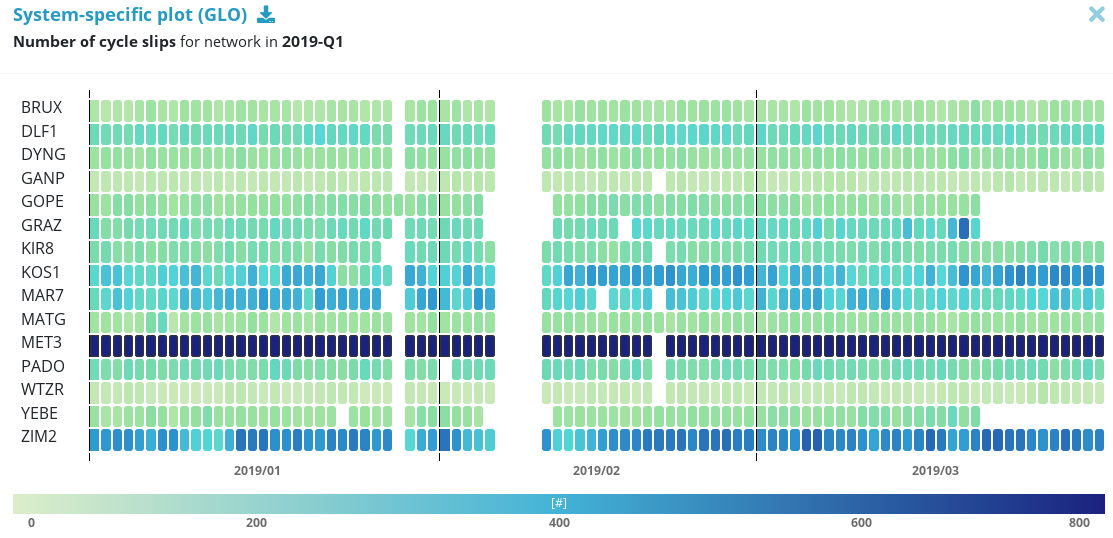
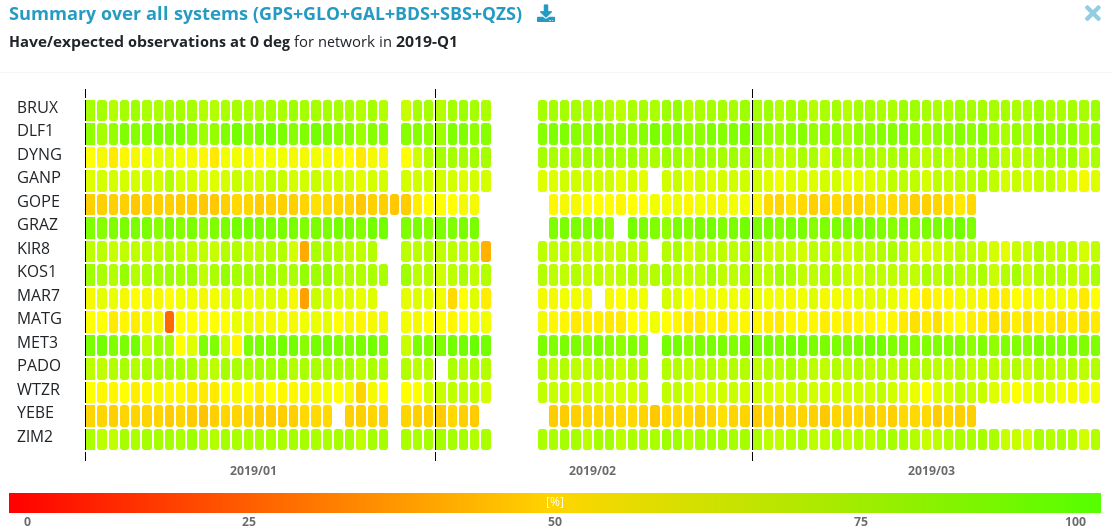
The figure illustrates two examples of two QC indicators defined for the network view, namely 1) availability of observations (existing vs. expected ratio), and 2) presence of carrier-phase cycle slips.
References
Václavovic P. and Douša J. (2016)
G-Nut/Anubis - open-source tool for multi-GNSS data monitoring
IAG Symposia Series, Springer, Vol. 143, pp. 775-782, doi:10.1007/1345_2015_157
Václavovic P. and Douša J. (2015)
Development Towards Advanced GNSS Data Quality Monitoring
Družicové metody v geodézii a katastru, Sborník referátů. Brno, ECON publishing, s.r.o, pp 76-81
Václavovic P. and Douša J. (2013)
Anubis – a tool for quality check of multi-GNSS observation and navigation data
4th International Colloquium Scientific and Fundamental Aspects of the Galileo Programme, 4-6 December 2013, Prague, Czech Republic